
If you’re firefighting every week, you don’t have a people problem, you’ve got a process problem you can’t see yet. Process mapping makes the work visible so you can fix bottlenecks with evidence, not opinions. If you want the wider operating system behind this, cross-reference Business Operations: The Complete Systems Playbook for SMEs as you build.
Done properly, a map gives you leverage: fewer handovers, less rework, faster delivery and a team that knows what ‘good’ looks like.
In this article, we’re going to discuss how to:
- Choose the right process to map so you get impact fast
- Build a simple visual map that exposes bottlenecks and waste
- Run 7 to 14 day tests to fix the process without breaking delivery
Process Mapping In Practical Terms
Process mapping is a visual record of how work actually moves from trigger to outcome, including who does what, what tools are used and where time gets lost. The point is not art, it’s control: you want a clear view of where the process bleeds time, money and attention, then a plan to tighten it.
A practical definition for founders is simple: a process map is your ‘receipt’ for how value is created, so you can stop guessing and start improving.
- Outcome: Shorter cycle time, fewer errors, predictable throughput
- Evidence: Time stamps, queue length, rework rates, handover count
- Artefacts: The map, a short list of bottlenecks, a test plan and an updated SOP
Sense-check you’re doing process mapping for the right reason:
- You can’t answer ‘Where does work sit when it’s not moving?’
- Lead times vary wildly for the same type of job
- Your best people are acting as human routers, chasing updates
- Customers ask for updates more than they should
Pick The Right Process So You Don’t Waste A Week
Busy founders fall into one of two traps: mapping something too big, or mapping something that isn’t the constraint. Pick a single process that matters to cash, customer experience or team capacity.
Use this quick filter. Choose the process that scores highest across these four questions:
- Revenue impact: Does improving it increase capacity or conversion this month?
- Customer pain: Is it linked to complaints, churn or slow delivery?
- Volume: Does it run 10+ times a week so gains compound?
- Control: Can you actually change it without third parties blocking you?
If you’re stuck, start with one of these: client onboarding, quotation to invoice, fulfilment dispatch, support ticket resolution, hiring pipeline, content production, or cash collection.
Gather Signals And Data In 2 Hours (Internal First, Then Public)
You don’t need a data team, you need a clear snapshot. In two hours you can gather enough to stop arguments and focus on the constraint.
Internal Signals To Pull Today
Pick a 10 to 30 item sample from the last 2 to 4 weeks and grab what you can from your tools (CRM, helpdesk, project board, accounting, Slack).
- Lead time: Start date to finish date (median and range)
- Touch time: Estimated time actually spent working, not waiting
- Queue size: How many items sit at each stage on a normal day
- Rework rate: % of items sent back or corrected
- Handover count: Number of people involved end to end
A useful quick calc: if the median lead time is 12 days and the median touch time is 2.5 hours, you’re not slow because you work slowly. You’re slow because the work waits.
Public Signals To Sanity-Check Expectations
Then look outwards for 30 minutes. You’re not copying competitors, you’re calibrating what customers consider normal.
- Promises: What lead times do competitors publish?
- Reviews: What do customers praise or complain about on Trustpilot, Google or G2?
- Service levels: What response times are expected in your category?
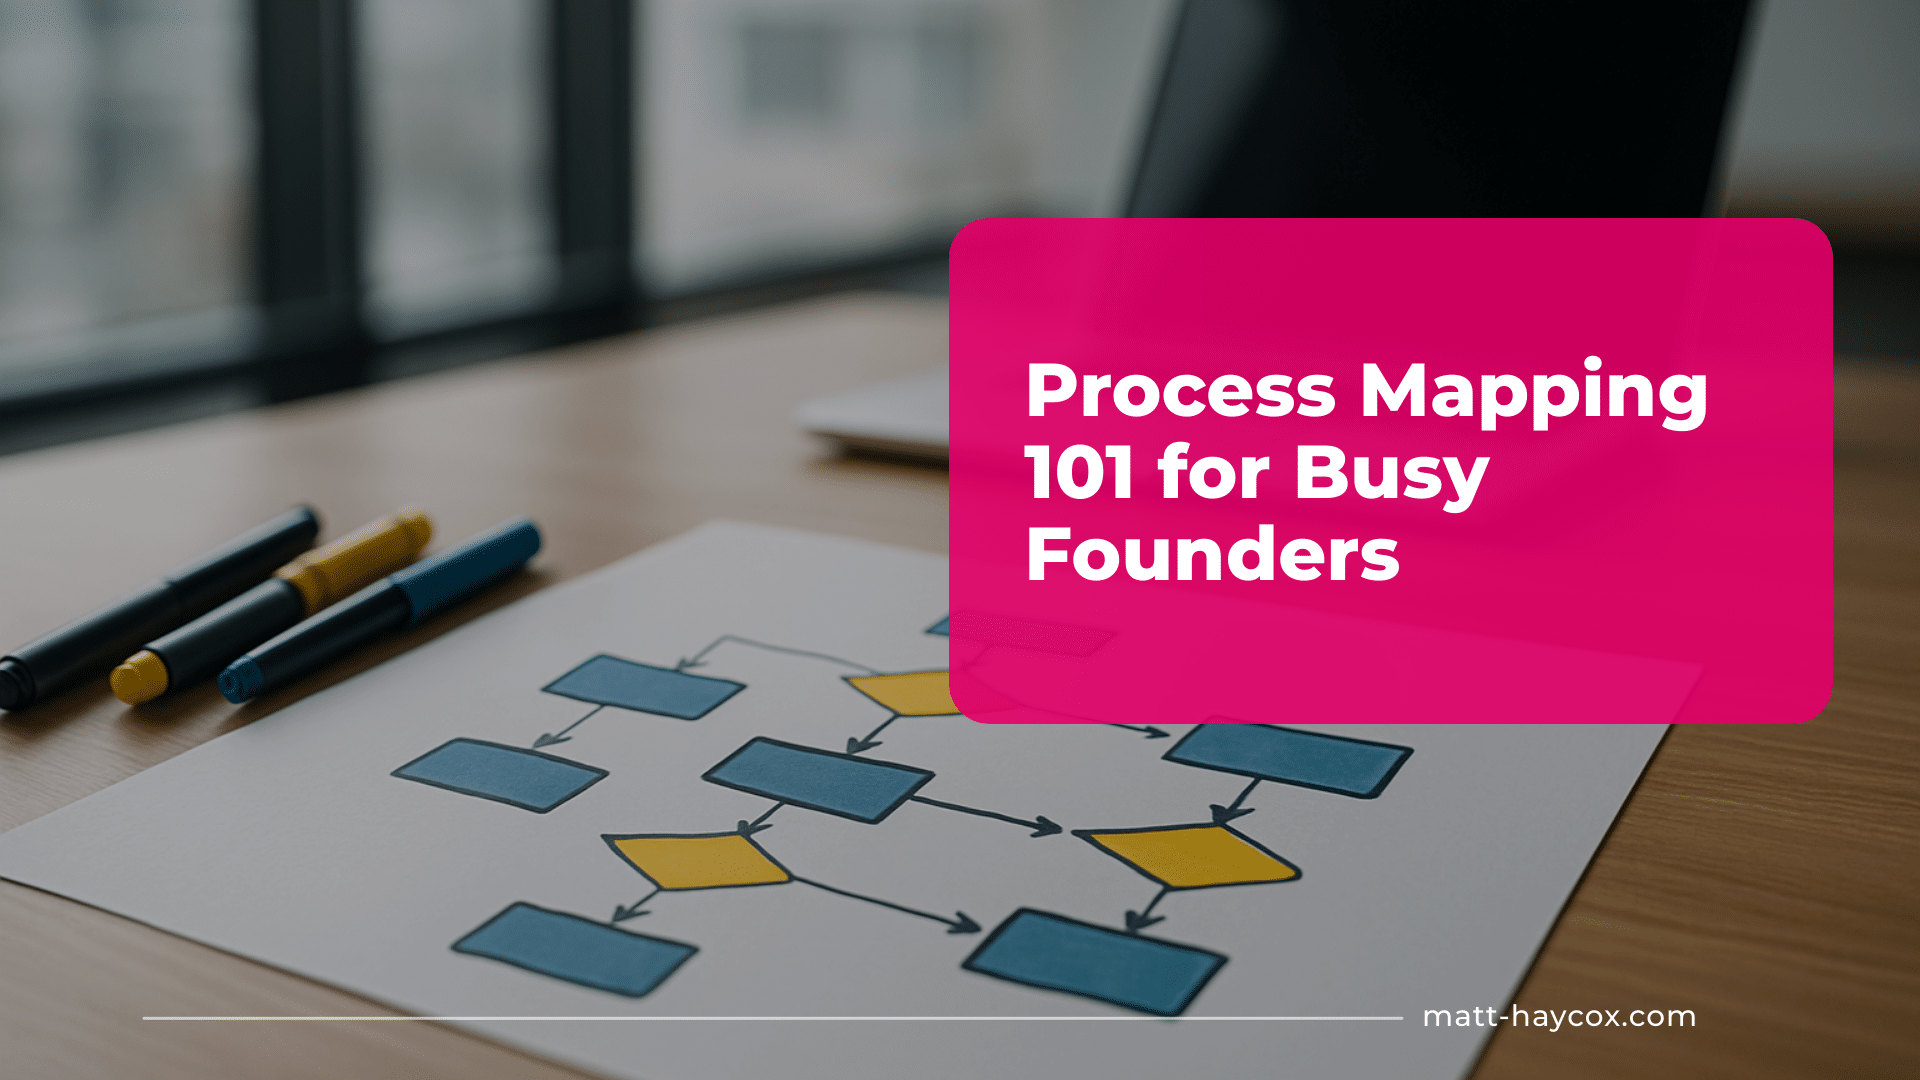
Build The Map: Simple Beats Perfect
For process mapping to work in real operations, you need a shared language that your team can update without you. Keep the first version to one page, then refine. If it takes longer than 60 to 90 minutes to sketch, you’ve made it too complex.
Use A Clear Visual Structure
Here’s a structure that works across service, e-commerce and internal ops:
- Trigger: What starts the work (a form, payment, ticket, order)
- Stages: 5 to 9 steps max, written as verbs (Qualify, Draft, Review, Deliver)
- Decision points: Yes or no gates (Approved? Paid? Needs more info?)
- Owner: One role per step, not ‘everyone’
- System: Where it happens (CRM, inbox, Asana, ERP)
- Exit criteria: What must be true to move on
A founder-friendly rule: if a step doesn’t have an owner and an exit criterion, it isn’t a step, it’s a wish.
Make Bottlenecks Obvious With Four Tests
Most bottlenecks hide behind busyness. The map turns busyness into measurable friction. Run these four tests on your map and your sample data, you’ll spot the real constraint quickly.
Test 1: Queue Size And Waiting Time
The bottleneck is usually where the queue forms. If ‘Review’ has 18 items waiting and everything else has 2 to 4, that’s your constraint, even if the reviewer is your best person.
Test 2: Rework And Loops
Mark every loop on the map: ‘Back to customer for more info’, ‘Redo because spec changed’, ‘Fix formatting’. If 30% of items loop once, your throughput is capped even if people work hard.
Test 3: Handover Count
Each handover adds delay, context loss and a chance of misinterpretation. If a straightforward job touches 6 people, the map is telling you the process is doing the work, not the team.
Test 4: Uneven Batch Sizes
Batching creates hidden waits. Example: a team member prepares quotes daily, but approvals happen weekly. Your lead time becomes ‘up to 7 days’ before you even start delivering.
Quick calc to make this real: if you batch approvals weekly and you receive work evenly, the average wait caused by batching is about 3.5 days. That’s before any actual work gets done.
Write A One-Sentence Offer Template For The Process
Founders often map work without stating the promise. A clean promise forces clarity on scope, handovers and what ‘done’ means.
Offer template: ‘We help [type of customer] achieve [specific outcome] in [timeframe] by [method], with [proof or guarantee].’
Now tie the process to that promise. If your process cannot deliver the timeframe without heroics, either fix the process or change the promise. Do not keep selling a fantasy and hoping ops catches up.
Turn The Map Into A Fix Plan That Fits A Busy Week
A map without action becomes wall art. The fix plan should be a short list of interventions, each with an owner, a deadline and a measurable change.
Use this decision rule: fix what reduces waiting, rework or handovers first. Those three create most of the hidden cost.
Three High-Leverage Fix Types
These are boring, which is why they work:
- Front-load clarity: A better intake form, clearer brief, mandatory fields, examples of ‘good’
- Standardise the work: Templates, checklists, SOPs, a definition of done
- Change the flow: Limit work in progress, add a daily review slot, reduce batching
Completion check: your fix should change a number within 2 weeks, not just ‘feel smoother’.
Validation Path: Small Tests In Days, Not Months
You don’t roll out a new process across the whole business. You run controlled tests that protect delivery and tell you if the change actually helps.
Here’s a validation path you can run this week:
- Day 1: Map the current process with the people doing the work, not managers
- Day 2: Choose one bottleneck and one intervention, write down what you expect to change
- Days 3 to 7: Test on a small slice, 10 to 20 items or one client segment
- Days 8 to 14: Compare metrics to baseline and decide: keep, tweak or kill
Make your test measurable. Example: ‘If we add a mandatory intake checklist, rework will drop from 28% to under 15% within 10 days.’
Pricing And Unit Economics: Don’t Fix The Process And Still Lose Money
Bottlenecks don’t just slow delivery, they quietly destroy margin. Process mapping helps you see where cost accumulates so you can price properly and protect your time.
Do this simple unit economics pass on the mapped process:
- Step cost: (Minutes per step) x (loaded hourly rate) for the role
- Rework cost: Rework rate x step cost of the reworked steps
- Support cost: Number of customer updates x minutes per update
Micro example: a £2k onboarding package.
Let’s say your mapped process shows 6 hours of delivery time across roles. If your blended loaded cost is £45 per hour, direct labour is £270. If 25% of clients trigger 2 extra hours due to missing info, that’s an additional £22.50 per client on average. Add 4 status-chasing calls at 8 minutes each, another £24. That’s £316.50 before software, admin and management time.
If your gross margin target is 70%, your maximum allowable delivery cost is £600 on a £2k package. You look safe until you remember the hidden work: approvals, scheduling, QA and the founder ‘just checking’. The map makes that visible, then you can either remove it, automate it or price for it.
Operational Guardrails That Protect Margin And Time
Fixing a bottleneck once is easy. Keeping it fixed is the work. You need guardrails that stop the process drifting back to chaos as volume rises.
Pick a few guardrails that suit your operation:
- Work in progress limit: Cap the number of live items per role, for example no more than 5 active client onboardings per implementation manager
- Service level targets: Response within 4 business hours, delivery within 5 business days, or whatever your category needs
- Definition of done: A short checklist that must be true before moving to the next stage
- Escalation rule: If an item waits more than 48 hours, it must be escalated to a named owner
- Weekly review cadence: A 30 minute ops review with three numbers: throughput, rework %, ageing items
Tip that saves founders: assign ownership to roles, not names. People change, roles persist.
Micro Cases: Three Quick Bottleneck Fixes That Actually Stick
Case 1: Manchester marketing agency, client onboarding
They mapped onboarding and found 40% of delays were waiting for ‘brand assets’. Fix was a single intake form with mandatory uploads and a ‘no assets, no start’ policy. Median onboarding time dropped from 12 days to 7 days in 2 weeks, complaints fell, cash collection improved because delivery started on schedule.
Case 2: Midlands e-commerce brand, returns handling
The map showed returns sat in a physical pile until one person processed them every Friday. They changed to daily 30 minute processing with a WIP limit and a simple barcode scan step. Refund lead time dropped from 9 days to 3 days, Trustpilot reviews improved and support tickets fell by 18% in a month.
Case 3: London B2B software team, sales to implementation handover
Process mapping exposed a handover gap: deals closed without a confirmed scope, so delivery constantly reworked. They added a 15 minute ‘scope lock’ call and a signed implementation checklist before moving the deal to delivery. Rework dropped from 33% to 14% over 14 days, and the team stopped blaming each other.
Common Risks And The Hedges That Stop Naïve Mistakes
Most process mapping failures come from good intentions and poor execution. Watch for these and hedge early.
- Risk: Mapping the ‘ideal’ process instead of reality.
Hedge: Start with a recent real job and trace what happened, step by step. - Risk: Over-engineering with 40 boxes and 12 decision points.
Hedge: Force a one-page draft first, then add detail only where the data shows pain. - Risk: Treating the loudest opinion as the bottleneck.
Hedge: Use lead time, queue length and rework % to decide. - Risk: Fixing the wrong thing and pushing the constraint downstream.
Hedge: After each change, re-measure the next queue and confirm where the new constraint is. - Risk: ‘We’ll document it later’ and it never happens.
Hedge: Update the SOP within 24 hours of a successful test and attach it to the workflow tool.
Download The Operations Dashboard Template And Run Weekly Fixes
If you want process mapping to pay off, you need a simple rhythm for tracking throughput and bottlenecks every week. Download the Operations Dashboard Template (KPIs, Tasks, Delivery Status), then use it to run a 30 minute weekly ops review where you pick one constraint, run one test and lock in one guardrail.
Key Takeaways
- Process mapping works when it shows how work really flows, with owners, exit criteria and a baseline of lead time, queues and rework %.
- Validate improvements with small 7 to 14 day tests tied to measurable outcomes, then kill what doesn’t move the numbers.
- Protect margin and time with guardrails like WIP limits, service levels and a clear definition of done, not more meetings.
FAQ For Process Mapping
What’s the difference between a process map and an SOP?
A process map shows the flow of work across people and systems, an SOP explains how to do one step consistently. Map first to find the constraint, then write or tighten the SOP where it matters.
How detailed should process mapping be for a small business?
Start at one-page level with 5 to 9 stages and only add detail around bottlenecks. If the map can’t be explained in 3 minutes, it’s too detailed to run in live ops.
What’s the fastest way to find a bottleneck from the map?
Look for the biggest queue and the longest waiting time between steps, then confirm with a sample of recent jobs. The constraint is where work sits idle most often, not where people feel busiest.
Which tools should I use for process mapping?
A whiteboard, Miro, Lucidchart or even Google Slides will do as long as the team can edit it. The best tool is the one that stays updated after week one.
How do I measure whether the process fix worked?
Choose 2 to 3 metrics before you start, typically lead time, rework % and throughput per week. Compare a small test group against your baseline within 7 to 14 days.
Can process mapping help with delegation?
Yes, because it removes ambiguity about what happens next and what ‘done’ means. Once the map is clear, you can delegate steps to roles with tight checklists and fewer handovers back to you.
What if the bottleneck is me?
That’s common, especially around approvals and decisions. Put a time-boxed approval window on your calendar daily, or define criteria so the team can approve without you.
How often should I update my process map?
Update it after any change that affects flow, tooling, roles or promises, and review it quarterly. If your metrics drift or queues reappear, the map is telling you it’s time to refresh.